Yet over ten years, the region's home values grew 52%, against 93% nationally. Buyers here are paying for the location, not for a fast-rising market.
 ZipInform
Three complete sample reports
Before you buy, rent, or sell a home, know the area around it.
Deeper data. Clearer judgment. Any area.
A listing tells you about the property. ZipInform helps you understand what comes with the address: home values and rents, property taxes, schools, commute patterns, safety, hospitals, neighborhoods, local risks, and the questions worth checking before you commit.
These Washington, Santa Fe, and St. Louis reports show the same kind of due diligence we can do for any ZIP code you are considering.
The facts are useful. The connections can be even more useful.
Every report closes by asking: what is this ZIP really telling you?
ZipInform first gathers the evidence. Then the closing analysis looks for what the numbers say together. One of the most revealing measures is simple: how many years of rent it takes to equal the price of one home. Across the U.S., a typical home costs about 19.6 years of typical rent. When a ZIP is far above that, buyers are paying a lot for ownership itself: a lasting foothold where homes are scarce, protection from future rent increases, or the hope that values keep climbing. That can be a good bet. It is still a bet, and it is worth knowing before you make it.
The analysis then checks that against how prices have actually moved, and against taxes, schools, and daily travel, while staying honest about what only the particular home can tell you. And when buying is the goal, a tough tradeoff in one ZIP can be a reason to compare a few others, not a reason to give up on buying.
Home values across the wider Santa Fe area rose 102% in ten years, slightly faster than the nation. That history helps explain the high cost of owning, but it is not a forecast.
Prices rose 4.1% last year, faster than the U.S., but trailed the nation over ten years. At 22.8 years of rent, buying costs more than average here, but not dramatically so.
Three places, three different stories
Open the reports, or start with the main thing each one helps you notice.
These are finished ZipInform reports, not mockups. Each sample uses the data and local context available for that ZIP, so the emphasis changes with the place.
Washington, DC · 20008
A high-cost ZIP where buying and renting tell very different stories.
Washington's 20008 shows why it helps to look beyond the listing. The report maps the ZIP, separates the neighborhoods and housing patterns inside it, and puts schools, taxes, safety, transit, hospitals, and everyday access into the same frame. It also shows a striking difference between the cost of buying into the area and the cost of renting there.
A quick market read
Typical home value$965,100
Typical rent$2,206
Years of rent to equal one home36.5
Home prices vs. the region+66%
Rents vs. the region+9%
36.4% owner63.6% renter
What ZipInform noticed here
Living here costs a little more. Owning here costs a lot more.
Renting in 20008 costs about 9% more than across the wider Washington area. Buying costs about 66% more. Put another way, a typical home here costs 36.5 years of typical rent, compared with 23.8 across the region and 19.6 nationally, more than in 94% of U.S. ZIP areas. The price history makes that worth understanding: over ten years, home values across the wider Washington area rose 52%, about 41 points less than the nation. Buyers here are paying for the place itself, not for a fast-rising market.
- Buying costs 36.5 years of rent, more than in 94% of U.S. ZIP areas
- The region's prices lagged the nation over one, five, and ten years
- Most homes are in larger buildings, so the homes people buy and rent may not be like-for-like
Look inside the finished report
See the geography first. Then see how the report pulls the evidence together.
The first preview shows the ZIP itself. The second jumps to the closing analysis, where pricing, trends, taxes, schools, commute, and other evidence are read together and turned into practical questions for the next step in your search.
Open the complete Washington report →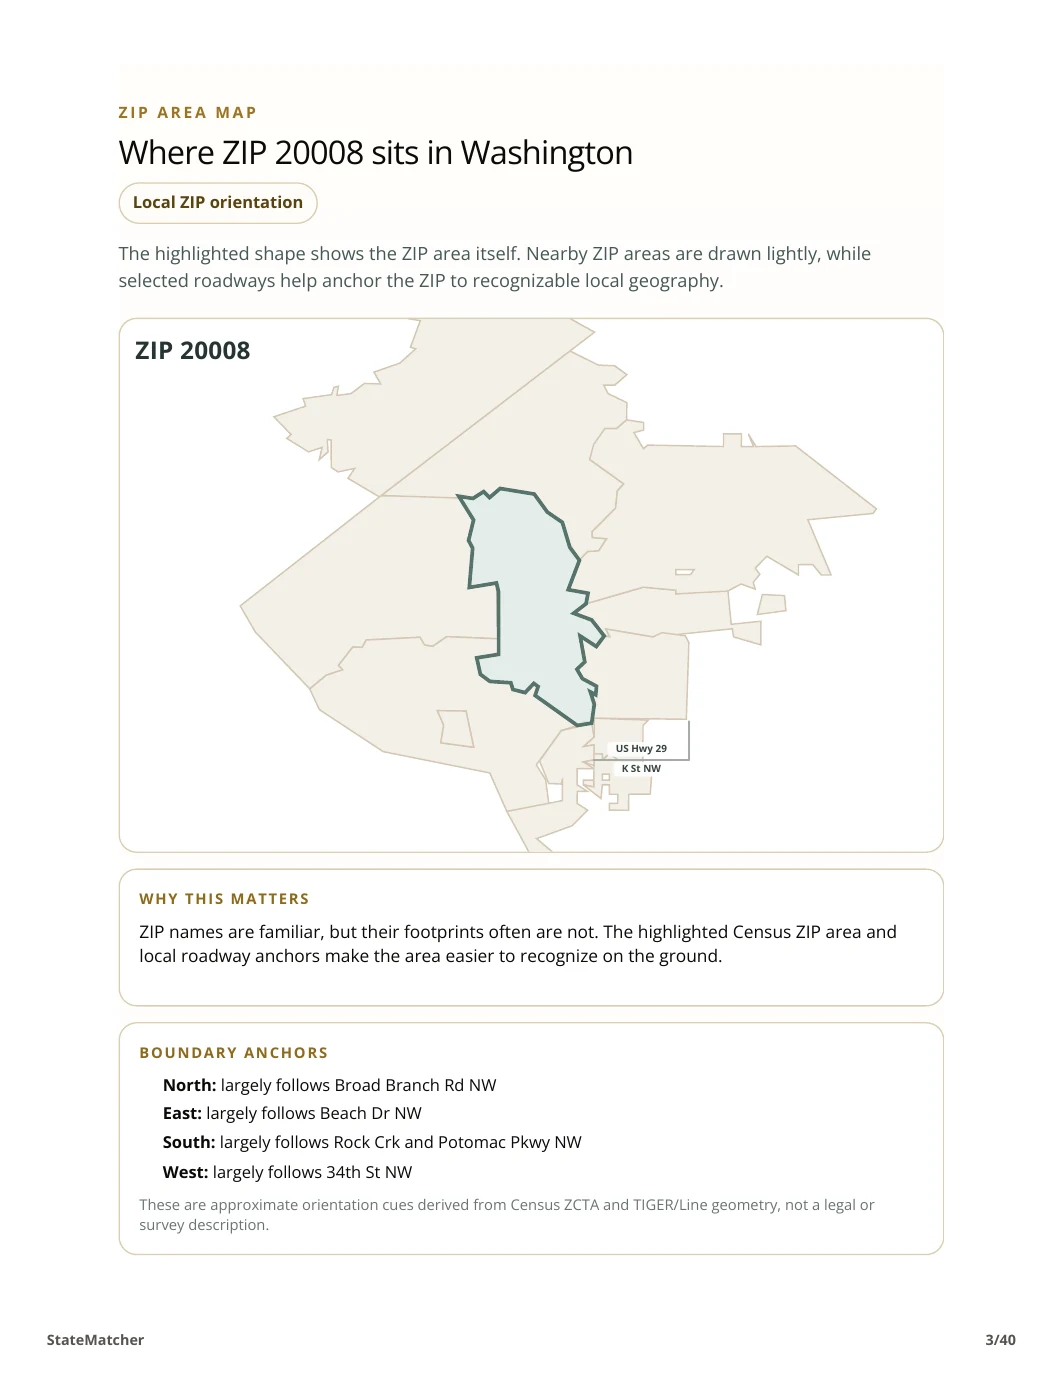
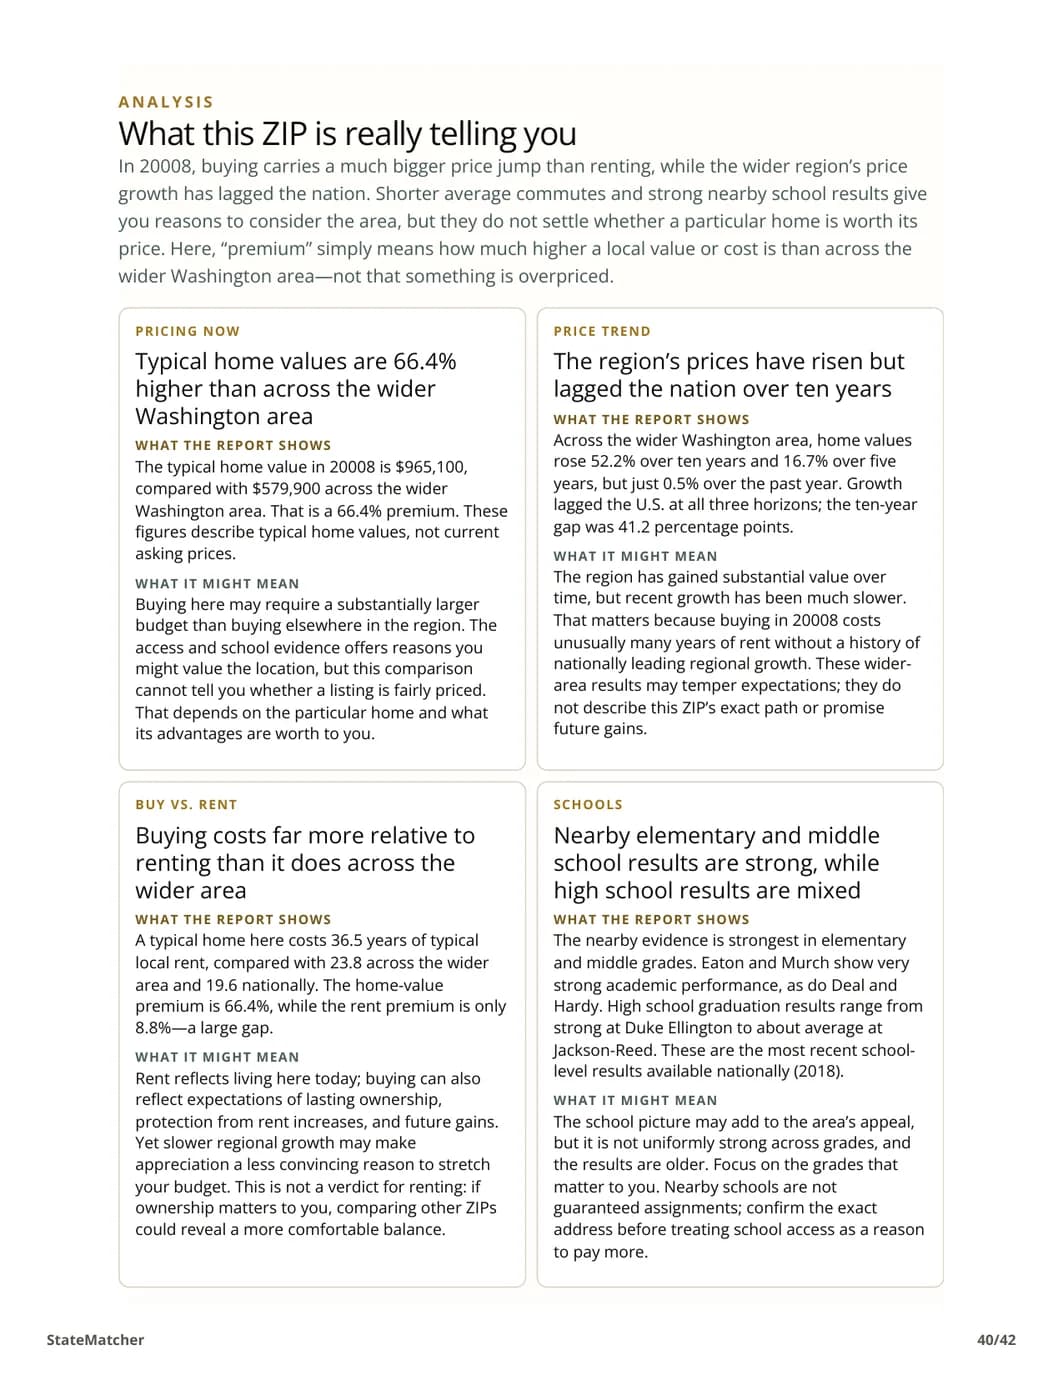
From the sample report · Bottom line
The central tradeoff in 20008 is a high purchase price relative to rent, alongside travel patterns that rely less on driving alone than the wider Washington area. Buying deserves a clear personal reason beyond an expectation of rising prices: the wider area's home-value growth has lagged the U.S.
Santa Fe, NM · 87501
A historic market where the exact street and property matter as much as the ZIP.
Santa Fe's 87501 brings together a compact downtown, historic districts, irregular streets, older compounds, subdivision settings, and nearby foothill or county context. ZipInform helps a buyer or renter understand those differences without pretending that every address inside the ZIP works the same way.
A quick market read
Typical home value$673,100
Typical rent$1,635
Years of rent to equal one home34.3
Home prices vs. the region+51%
Rents vs. the region+18%
65.2% owner34.8% renter
What ZipInform noticed here
Buying costs far more than renting, and a decade of price growth helps explain why.
Renters in 87501 pay about 18% more than across the wider Santa Fe area, and buyers about 51% more. A typical home costs 34.3 years of rent here, versus 26.8 across the region and 19.6 nationally. Unlike many high-cost areas, the price history backs that up: home values across the wider Santa Fe area rose 102% over ten years, slightly ahead of the nation, and kept rising last year. The report also notices that the shorter average commute comes with almost no transit use, so the convenience comes from distance, not from buses or trains.
- Prices across the wider Santa Fe area doubled in ten years, slightly ahead of the U.S.
- A typical home costs 34.3 years of rent, versus 26.8 regionally
- Shorter commutes, but by car: transit is under 1% of trips to work
Look inside the finished report
See the geography first. Then see how the report pulls the evidence together.
The first preview shows the ZIP itself. The second jumps to the closing analysis, where pricing, trends, taxes, schools, commute, and other evidence are read together and turned into practical questions for the next step in your search.
Open the complete Santa Fe report →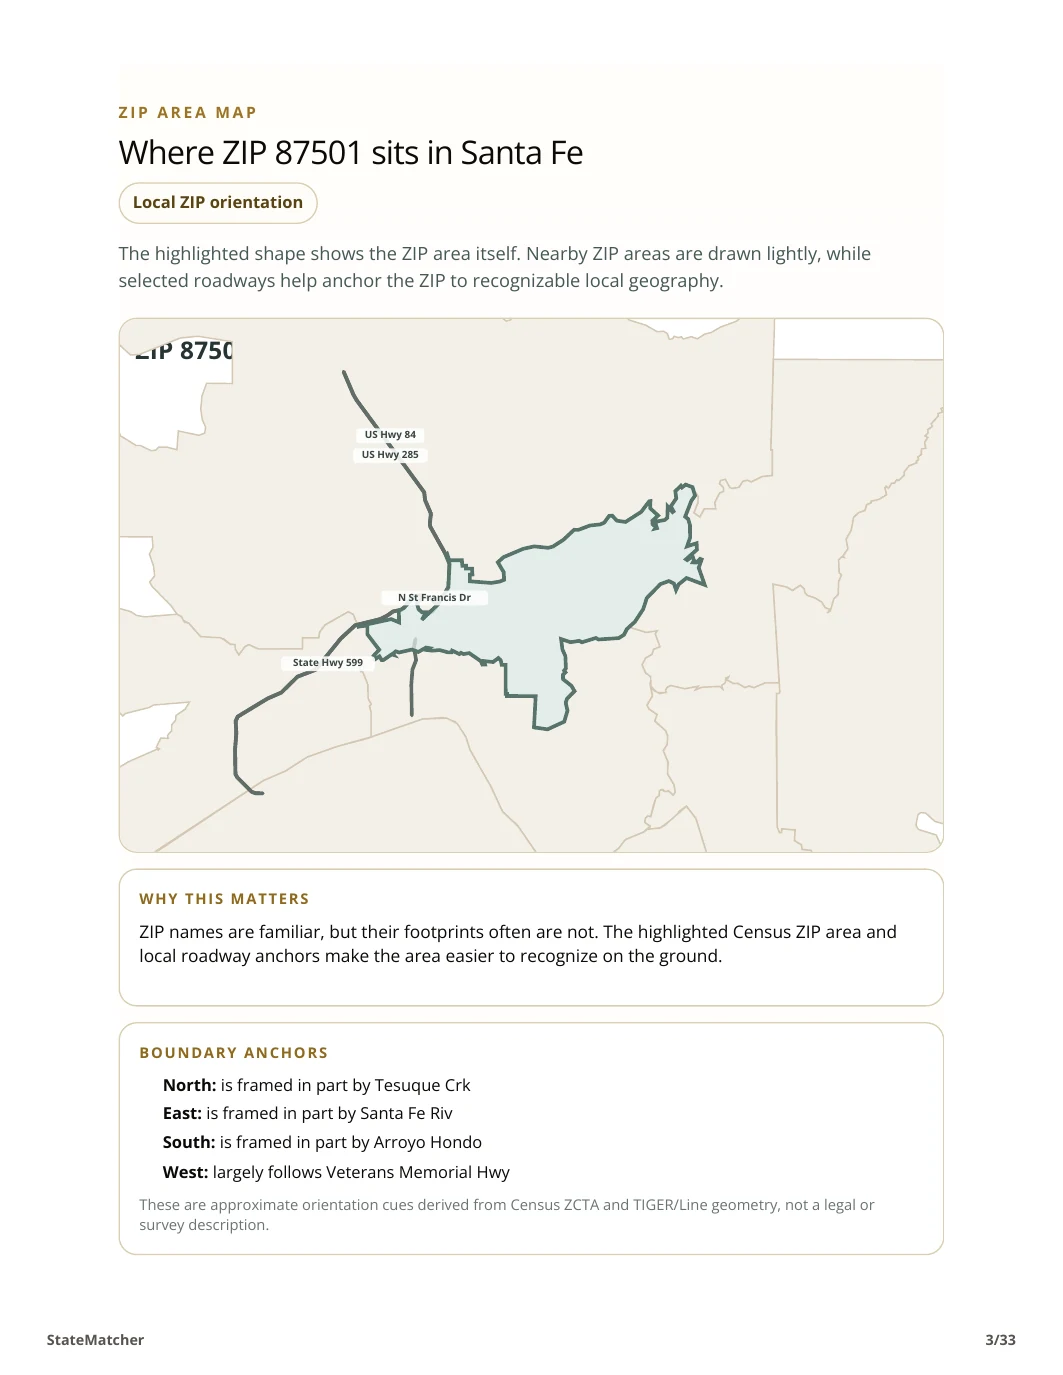
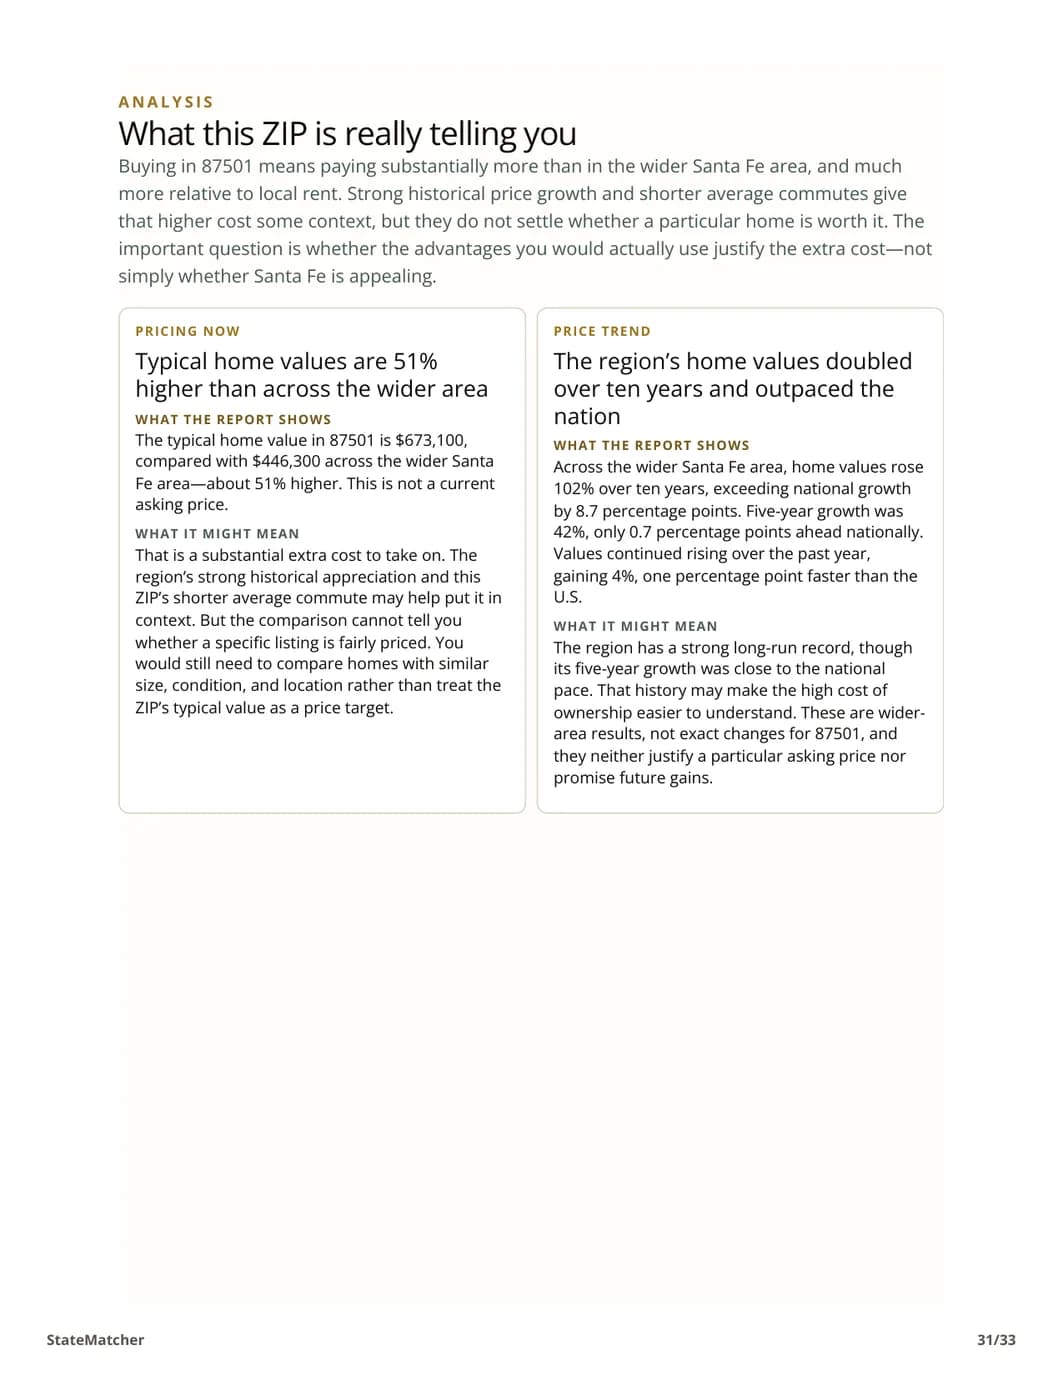
From the sample report · Bottom line
The central tradeoff is a costly purchase relative to rent in a place with distinctive cultural and outdoor appeal. Before committing, put the home price, actual property taxes, and your expected length of stay together.
St. Louis, MO · 63110
A neighborhood-rich ZIP where nearby blocks can come with different tradeoffs.
St. Louis's 63110 is a good example of why a ZIP should not be treated as one uniform neighborhood. The report separates Shaw, Southwest Garden, The Hill, Botanical Heights, Forest Park Southeast, parks, corridors, highway edges, and local transit into a more practical picture for someone comparing actual homes.
A quick market read
Typical home value$339,900
Typical rent$1,240
Years of rent to equal one home22.8
Home prices vs. the region+39%
Rents vs. the region+11%
43.6% owner56.4% renter
What ZipInform noticed here
A strong year doesn't erase a slower decade.
Renters in 63110 pay about 11% more than across the wider St. Louis area, and buyers about 39% more. At 22.8 years of rent per home, compared with 18.3 regionally and 19.6 nationally, buying costs more than usual, but far less dramatically than in Washington or Santa Fe. The price history pulls in two directions: values rose 4.1% last year, faster than the U.S., but over ten years the region trailed the nation by about 11 points. The report shows both instead of picking one, alongside a commute about six minutes shorter than the regional average.
- Last year beat the U.S.; the past decade didn't
- A typical home costs 22.8 years of rent, versus 18.3 regionally
- An average commute of 18.4 minutes, versus 24.9 across the region
Look inside the finished report
See the geography first. Then see how the report pulls the evidence together.
The first preview shows the ZIP itself. The second jumps to the closing analysis, where pricing, trends, taxes, schools, commute, and other evidence are read together and turned into practical questions for the next step in your search.
Open the complete St. Louis report →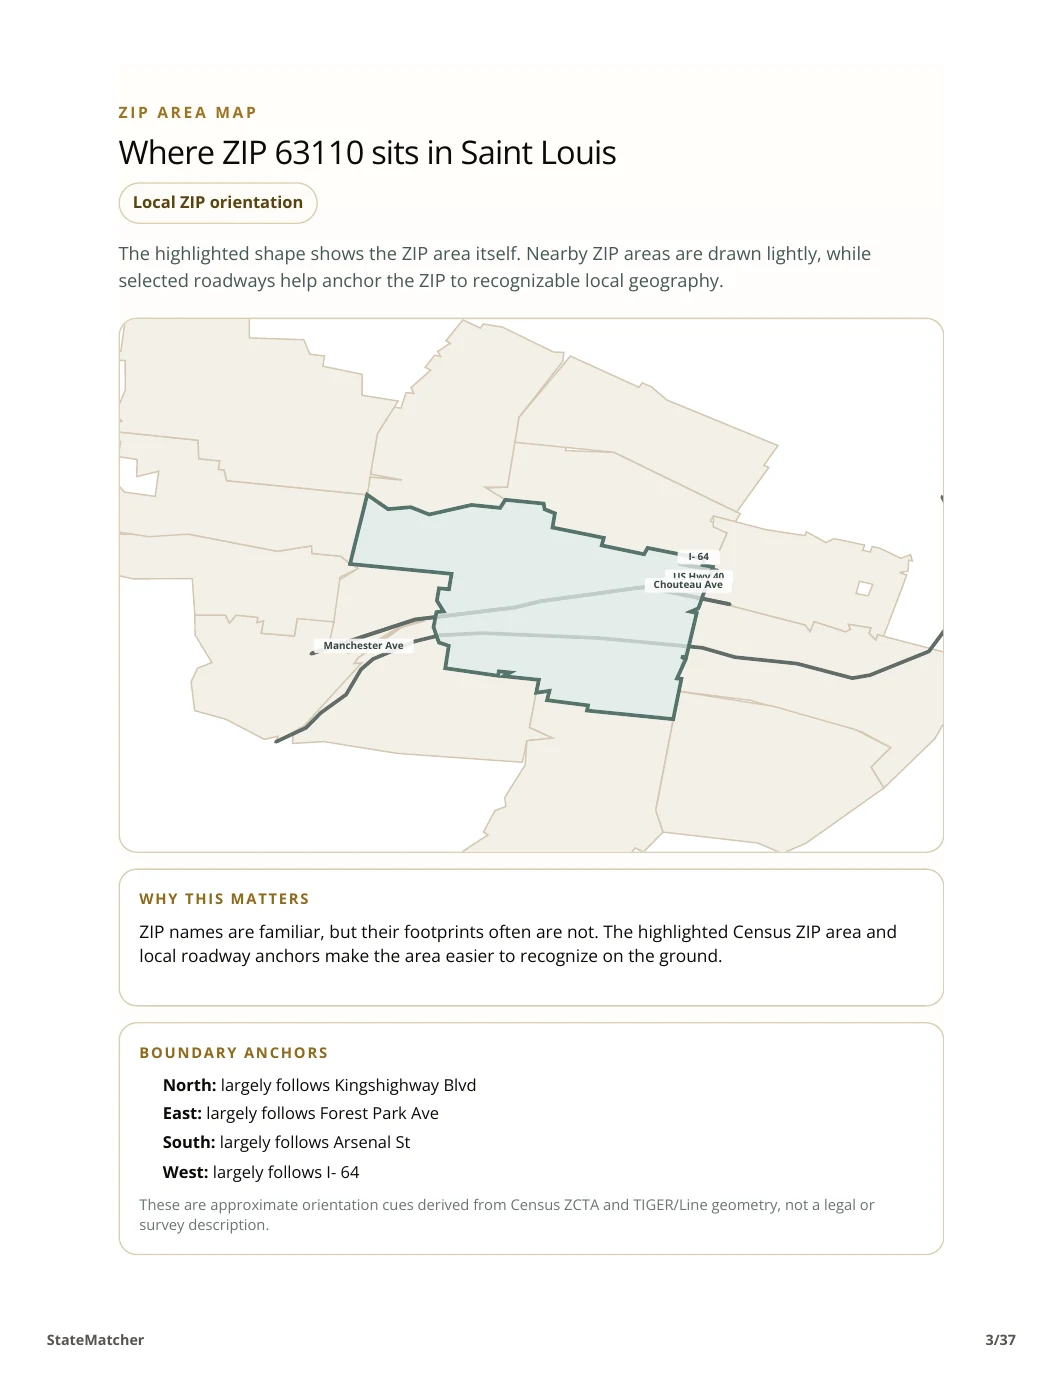
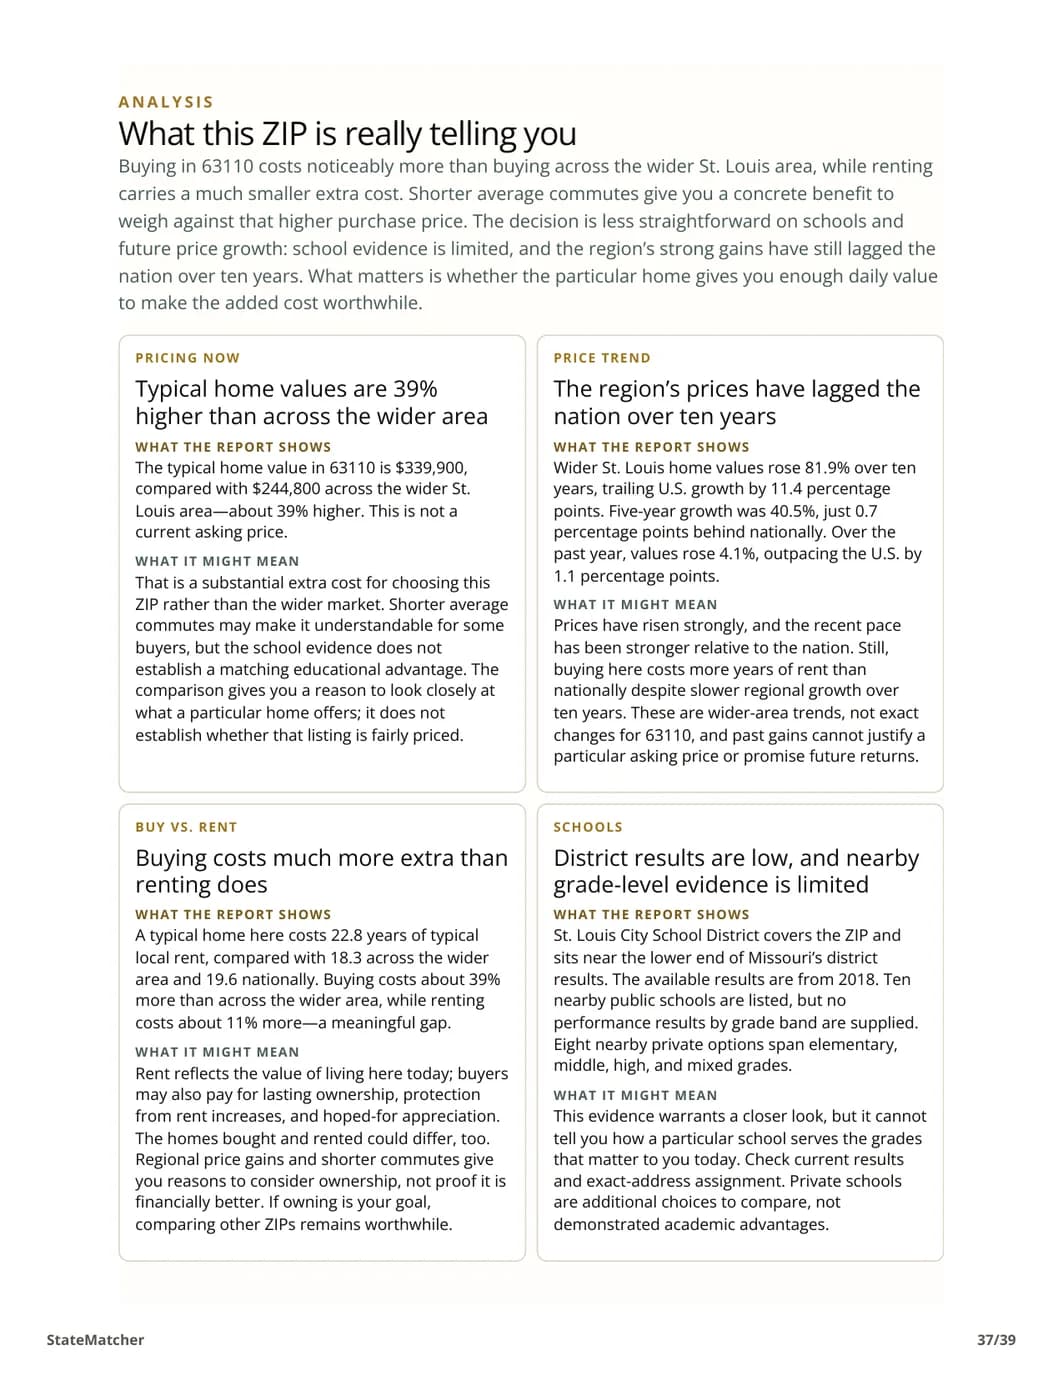
From the sample report · Bottom line
The strongest tradeoff here is a shorter average commute alongside a purchase price that is relatively high compared with local rent. That makes the decision less about the asking price alone and more about how long you expect to own and whether the home improves your daily routine.
Inside every ZipInform report
The information you would want to gather anyway—organized in one place.
Different questions are best answered at different geographic levels. Some are best answered for the ZIP itself, others for the county or wider region. ZipInform uses the most reliable data for each, tells you which is which, and keeps the final decision tied to the address you are actually considering.
Housing costs and price context
See home values, rents, how many years of rent it takes to equal one home, property taxes, and how prices have moved over one, five, and ten years compared with the region and the nation.
The ZIP and the places inside it
Start with the ZIP's actual Census footprint, then learn the neighborhood and district names you are likely to encounter in listings.
Schools and everyday access
Review nearby school evidence, commute patterns, transit, roads, hospitals, local institutions, and the practical routes that can shape daily life.
Safety, hazards, and insurance questions
Use broader-area safety evidence as context, not as a ZIP-level crime rate. The ZIP itself may be safer or less safe than the wider area, so local conditions still need to be checked around the exact home.
Green lights, watchpoints, and tradeoffs
See the local details that may be worth seeking out, the things that deserve caution, and the tradeoffs that can vary from block to block.
What this ZIP is really telling you
Finish with analysis that connects the facts, explains what they might mean together, and turns the remaining uncertainty into questions worth answering before you commit.
Now try the area you are actually considering
Do the homework before the decision gets expensive.
Enter a ZIP code, confirm the area before checkout, and ZipInform turns it into a finished home-search intelligence report for $9.